


Posts Tagged ‘impact’
Is training an outcome driven business or an activity driven function?
Over the past few years I have been pondering the question “Is training an outcome driven business or an activity driven function?” Think about it. Too many times we design training that links content to intended business results, deliver the course resulting in participant skill/knowledge change, but then just report the activity.
What I continually see in my experience are activity measures being reported by training functions versus the key impact to business results. For example, those being:
- Number of employees trained
- Hours trained
- Cost to train versus budget
- Level 1 end-of-course reaction results (one could argue that these data begin to report outcomes – those being participants’ reaction or satisfaction with the training experience)
I believe that these metrics are necessary and essential but they are activity metrics not outcome measures which are even more essential. Outcome measures should state the value that training has brought to the business . In other words: impact. So what are some outcome driven business metrics? There are many and they need to be chosen so that it is within the context of your company and its typical reporting measures. Here is the approach I use:

If you think of a training program as having a product life cycle (the stages through which a course bypasses) consider using 5 stages: 1) Forecast, 2) Design & Development, 3) Delivery, 4) Transfer, and 5) Impact.
Forecast. This helps management in its attempts to cope with the uncertainty of the future, relying mainly on data from the past and present and analysis of trends. Forecasting starts with certain assumptions based on the management’s experience, knowledge, and judgment. Elements I use in a training forecast are:
- Budget for all stages
- Design & development cycle time
- Number of employees trained
- Predictive Evaluation Impact Matrix ( Intention , Adoption , Impact )
- Predictive Evaluation ROI
Forecasting usually is coupled with a needs analysis in which the learning objectives are provided.
Delivery. The activity metrics used in delivery are typically:
- Expense versus budget
- Number of employees trained
- Training hours delivered
During delivery, outcome measures can be used. The measures I use are:
- End of course reaction
- Predictive Evaluation Intention Score
- Predictive Evaluation Belief Score
Transfer. The transfer outcome measure is the rate and degree that participants have applied training skills on the job. The transfer outcome measure I use is the Predictive Evaluation Adoption Rate.
Impact. Successful transfer should lead to increased employee and organizational performance which results in Impact – tangible business results from training. The impact outcome measure I use is the Predictive Evaluation ROI.
Thank you for reading and as always, I invite your comments and thoughts.
Learning to Performance Best Practice – a success story
Frequently I share best practices in the training and development field. Those of you have a read my posts previously know that I believe in a Learning to Performance approach . Here is a recent success in using this approach with one of my clients.
My client and their business issue. I was approached by the VP of HR for a very successful 100 year old global manufacturing firm. As we talked, I found out that a component of their 2012 business plan had teams working on five strategic initiatives. Early in the year, five task teams were operating with differing levels of consistency with respect to project management and milestones were being missed. The CEO, President, and the VP of HR realized that the company needed to implement basic project management (PM) across all five teams with the desire to institutionalize common PM processes and templates for future teams and institutionalize a common method for project management. Hence the call to me – “Can you help us?”
The solution. I recognized immediately that this opportunity was tailor made for the Learning to Performance approach . And so we began.
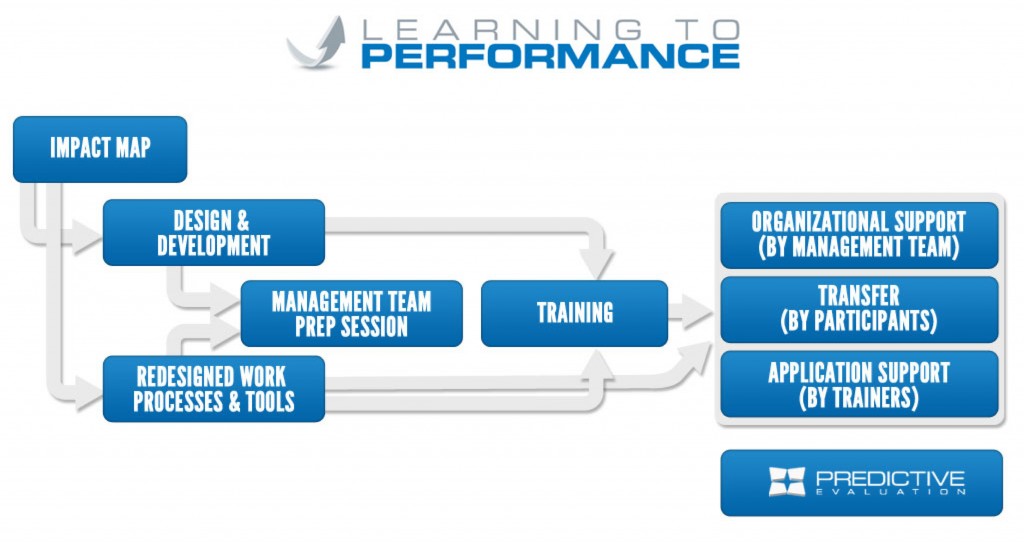
Step 1 – The Impact Map. First I formed a Steering Committee of the CEO, President, VP of HR, Training Manager, and myself who created a simple Impact Map that documented the project management skills, knowledge, and on-the-job behaviors:

Step 2 – Redesigned Work Processes & Tools . Before beginning instructional design, I created and proposed a simple project management process that all teams would follow. The trick here is to absolutely ensure that the process meets the needs of the company so that the process reflects the real work to be dome. To accomplish this, I performed an analysis of the firm’s project management level of maturity, skill & experience of the target audience, profile of the target audience in terms of skill, and provided simple but effective tools and templates to enable the process. After several meetings, the Steering Committee agreed upon the following process:

We also agreed to use an on-line project management collaboration tool called Smartsheet as the software for all project teams. To meet the need of a consistent use of tools, I created a standard project management template in Smartsheet with 3 standard documents that are required via the process. One incredible thing was that the President took ownership and reviewed, modified, and finally approved the Smartsheet template and documents. What a cool thing for a President to do!
Step 3 – Design & Development . With the Impact Map, tools, and process in place, it was easy to design and develop a 2-day hands-on workshop. I built the design so that participants were required to have an assigned company project that they would use during the workshop. 70% of workshop time was applying the process and using the tools as they mastered their new project management skills.

Step 4 – Management Prep Team Session . With all of the elements in place, I conducted a 4-hour management prep team session. In this session, 16 executives attended (all the CEO and President’s direct reports). In the session, I taught then we discussed:
- The project management workshop
- Project management principles & processes
- How to make project management work and be an executive sponsor
- Meeting with your employee before and after the workshop Providing post-workshop support
After this session, I met with the Steering Committee to talk about next steps. There I voiced that one of my concerns was that the firm was missing an Officer of Project Management to own and oversee the process. Without this piece we would have less than predicted transfer (performance on the job). The Steering Committee embraced the idea and a few weeks later I was informed that the VP of Operations was promoted to the Director of Project Management for the company. From that moment on the two of us worked together to make the rest of the Learning to Performance approach work. I also became his personal coach with respect to PM.
Step 5 – Training . 18 employees were selected to attend the workshop which included the new Director of Project Management. The design worked flawlessly. To aid in transfer to the job, the workshop incorporated 4 journaling points and a final action-planning module. The action plans were captured on-line via Survey Monkey while still in class. The next day, the action plans were sent via email to the participants and their managers thus facilitating a post-workshop conversation. The action plans were also sent to the VPs of HR and Project Management – participants were informed that this would be happening and were encouraged to write solid plans of action.
Step 6 – Organizational Support by the Management Team. All participants met with their managers within one week of the workshop to finalize their action plans and go over their projects. Participants then applied the process and used the Smartsheet collaboration tool and the standard templates to get their tasks done all while being overseen by the executive team and the Director of Project Management.
Step 7 – Transfer by Participants . The participants applied the project management process, tools, and templates while performing the project tasks. An enabling factor of the successful transfer was the collaboration function of Smartsheet. Participant work was immediately available and shared daily to their sponsors, project teams, Director of Project Management, and myself.
Step 8 – Application Support by Trainers (me). I was contracted to support each participant in the 60 days that followed the workshop. What I did was meet with each participant one-on-one for 1 hour at 30 and 60 days after the workshop. At the 30-day meeting we discussed their action plan and where they were with it. As needed, I then coached them on how to perform the work. In some cases the participant was doing so well that I provided advanced project management skills and showed additional features of Smartsheet. At the 60 day mark I reviewed there progress and talked about how they would use their new PM skills beyond their initial project.
I also met regularly with the Director of Project Management (at 30 and 60 days) and other times to coach him as he settled into his new role. As I talked to the Steering Committee during this time, one thing that they mentioned to me was that when participants knew I was coming at 30 and 60 days they sharpened their game so as not be embarrassed. Just the act of formal follow-up aided in successful Learning to Performance.
Step 9 – Predictive Evaluation . So did the company realize the results it had predicted in its Impact Map? The results are: Intention Evaluation : 100% of the action plans were judged as acceptable (employees are planning to do the things the firm required). Adoption Evaluation : Did we get the desired transfer (performance)? Absolutely! 17 out of the 18 participants had successfully transferred the predict behaviors documented in the Impact Map. That is a 94% transfer rate – an extraordinary adoption! Impact Evaluation : Here are the company’s results now versus industry standard (1) Performance Management results.

Thank you for reading and as always, I invite your comments and thoughts.
(1) Source: The Standish Group